Library eBoards with Synchronized Data
eBoards
When was the last time you looked at those TV screens hanging up in the hallways around the Library? If it was before this summer, then we recommend you glance again to see what's happening. Through the magic of APIs, we've developed ways for you to see library activity from our screens dynamically, and in real-time. We hope it might shape your day for the better!
Before
The Library furnishes five 38” vertically-oriented television screens near the entrances of the first, second, and third floors of the building, as well as a 54” screen in the Everett Cafe. Each of these monitors are connected to their own computer mounted on the wall immediately behind the monitor. Collectively, these monitors have been known as the Library’s “eBoards”. In the past, eBoards displayed a loop of content from a Google Slideshow that was edited by the Head Librarian and projected to each screen through an application called Splashtop from the workstations of Web Services and Operations team members.
The content on the eBoards was intended to inform patrons of events, exhibitions, and announcements pertaining to the library. All of the content on these screens was static: poster images created in applications like Canva that would be mounted and unmounted manually by the Head Librarian at their discretion. Additionally, the Everett Cafe eBoards featured a loop of newspaper covers selected by library associates and mounted on a similar Google Slideshow.
Although this process was fairly seamless and straightforward, it lacked the dynamics of other information screens one might see in daily life. Every subway rider in the five boroughs is familiar with displays that show when the next train is coming, and that type of on-the-spot responsiveness was our intention with this project.
Thesis
The team envisioned ways to deliver such an experience as early as Summer of 2023: using the Application Programming Interfaces (APIs) of such Library applications as LibCal and Occuspace, we could create pages built around displaying data from these platforms that would refresh automatically. This data could include information about our events and spaces through LibCal, or about the relative busyness of the library on a given day through Occuspace. We realized that this data could be just as informative to our patrons as it is to us, and thereby improve user outlook on our spaces.
For example, we could easily find out how many bookings we have in a room on a given day as a way of learning how much demand we have for reservable space at one point in the semester versus another. But since we have so many requests for reservations, and many days in which we’re booked solid during prime hours, then wouldn’t our patrons potentially find that information useful, too?
Our earliest considerations for this project were how to make data from these APIs exist in a dynamic space that could be understood and interpreted by our patrons like other information, such as our event poster loop. The easiest way to do this would be to designate a space online somewhere – indeed, a free-standing website – that could serve as the content of our eBoard slides, which would update as freely and automatically as the data itself updated. That way, we could use the website’s javascript to take data from the APIs and make different information appear in the HTML, which accounts for all of the site's visible content.
Beginnings
We began the ideation process for the website by making mock-ups of our intended final product. We felt from the beginning of the project that the ‘carousel’ nature of the content should be mimicked closely from the previous configuration, both as a continuation of that user experience, and because it would afford us the ability to share a wider variety of content. Although we ultimately arrived on a different look and feel, this is how those mock-ups appeared near the beginning of the project:
We also tested our API functionalities using Insomnia, a program for API development. With Insomnia, we managed to initiate the APIs’ URL-based calls to the LibCal and Occuspace servers and get data back as Javascript Object Notation (JSON) files. Depending on what was initiated in the URL, we could get back a wide range of data in a JSON file, including specific information about reservations and events.
Development
We then brought our functional API calls to a lengthy collaboration with a developer on the applications development team of TCIT. With his support and expertise over two solid months of the project, we were able to carve out HTML responses for each of the possible conditions for each API on three separate eBoard pages shown in our initial mock-up. Given the ‘carousel’ nature of the display, these pages would come to be known colloquially as the “Occuspace Slide”, the “Rooms Slide”, and the “Featured Event Slide”.
“Occuspace Slide”
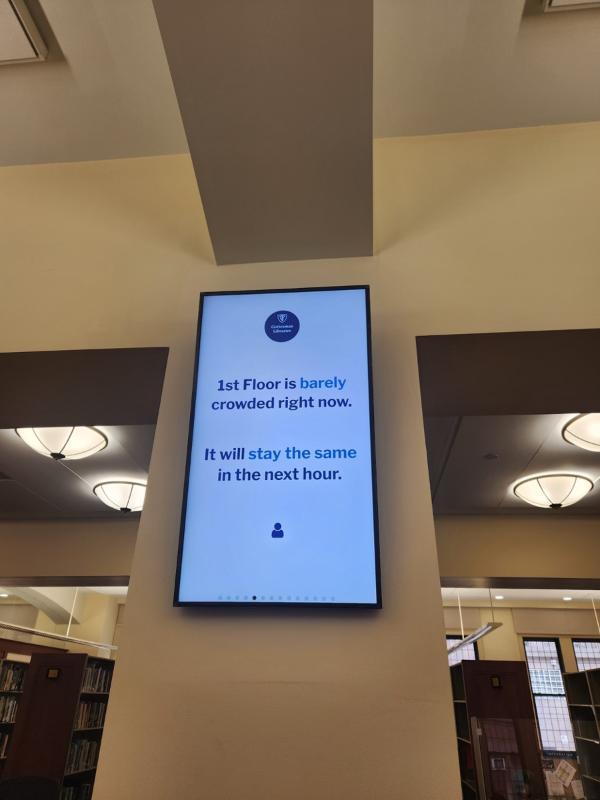
The idea for this content emerged in the Fall Semester at around the time our Occuspace system was going online. The data we collect from this system shows us the occupancy-level of any of those spaces at any given time. JSON data packages from the Occuspace API, similarly, showed these occupancy levels in literal numbers of people and occupancy percentages of the cap set for those spaces on the system’s backend. In an effort to translate this data to a literal, readable message, we graded the percentage levels as follows:
|
>15% |
“Barely” |
|
15-30% |
“Somewhat” |
|
30-50% |
“Moderately” |
|
50-70% |
“Very” |
|
<70% |
“Extremely” |
The javascript was written to interpret the JSON data and then arrive at a selection for the present occupancy level, and then deliver that message to the site’s HTML to be rendered on the appropriate eBoard’s screen. After another round of style revisions later in the Spring, one of the Library’s design associates arrived at this mock-up:
The visuals were subsequently translated into CSS by our content partner in TC Generation before going live.
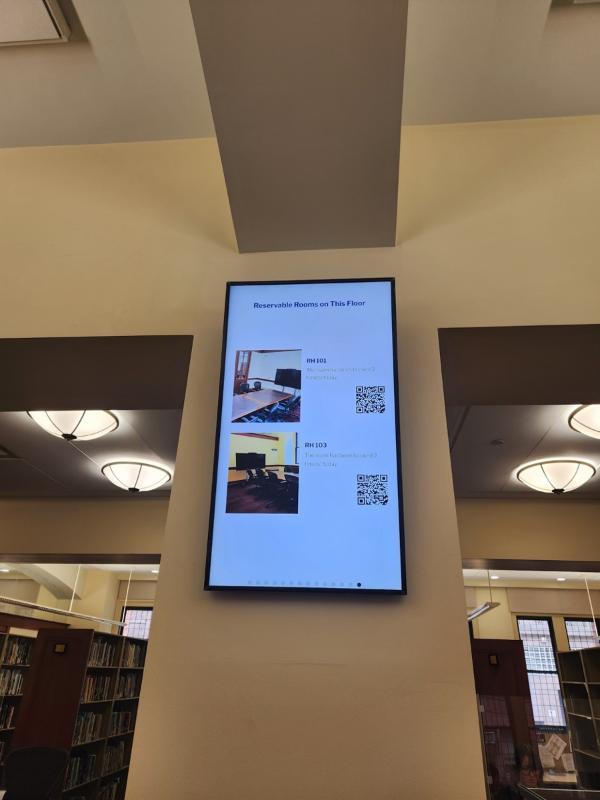
“Rooms Slide”
Because reservable rooms are such a valuable asset to library users, we theorized that a message about the number of reservations made on the present day would catalyze users to get their reservations in for the times they’ll need them – including that day. We wrote our javascript to simply count the total number of bookings shown for a room selected by the API and read that number directly into the HTML.
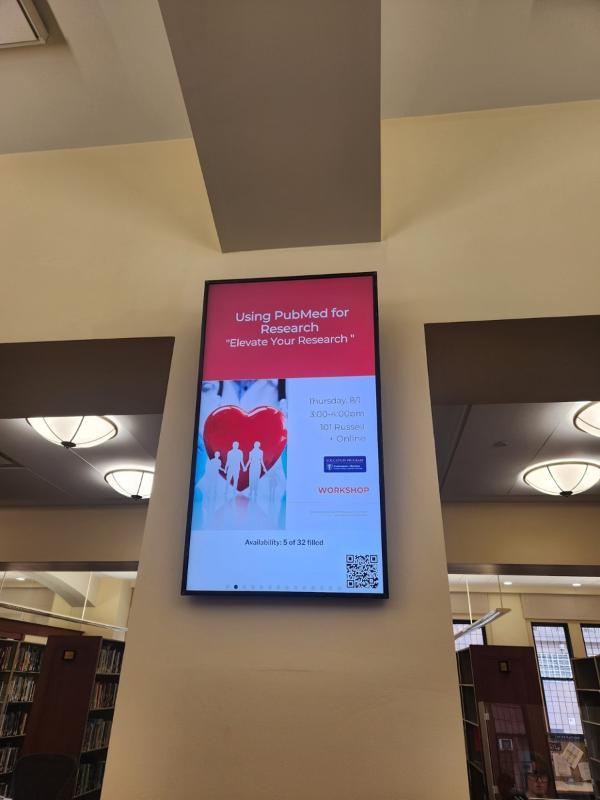
“Featured Event Slide”
Our eBoards’ previous configuration put a premium on showcasing upcoming events in the Library, and we wanted to make room for that in our new system – with a few improvements. In addition to featuring the event poster, which accounted for all of the content in the previous configuration, we also wanted to provide a QR code to users to lead them directly to the event page upon scanning. We also wanted to show how many “seats” were available in the event, to show that registration numbers are limited. We believe that this could create an impetus for some users to register for an event with dwindling availability.
While we began conceptualizing how this content could work through a LibCal API, the solution we ultimately arrived upon was much simpler: using the RSS export from LibCal that powers the event feed on the Library’s site.
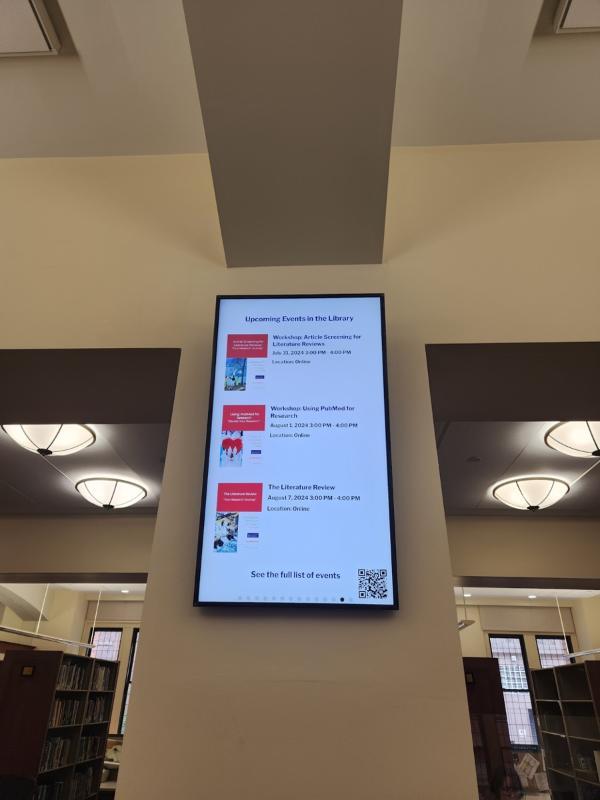
We first enabled this feed over the previous summer to make displaying our events in the College’s content management system (CMS) a simpler process, and planned on using it again to deliver data to our “Weekly Events” slide. It was in the development of that process that we understood that the CMS could be programmed to interpret individual event segments of the feed and automatically generate new slides for each event that honored a specific data rule. We then created a unique identifier for these events, a category called “Featured”, which would allow the CMS to recognize events for which it needed to create a new page.
Adding a QR code to an event automatically proved challenging, at first. Our earliest impulse was to manually create one for each event in Adobe Illustrator, add it to the HTML description of each event, and write the javascript for the slide to retrieve the code from the event description shown in the JSON package and deliver it to the page’s HTML. (All this while also suppressing the code from the live event description on the website with a CSS fix.) Instead, our content partner in TC Generation eventually found a PHP script to generate a new QR code for each event automatically as a parallel process to the RSS feed.
It was around the implementation of the RSS export feed as a solution that we grappled with a new problem with our APIs: how to grab the data from these systems without exposing our tokens on the front end through javascript. It had been clear that this would be an eventual hurdle in the process, but it wasn’t until late in April that we arrived at a solution.
Token Problems
When our javascript had been making calls to get data from the Occuspace and LibCal servers, it had been doing so with an authentication piece called a token. These tokens could only be accessed in the backend of these systems or through the system’s administrators. As a matter of fact, we couldn’t access our LibCal token until we used a separate POST API authenticated with our Client ID and Secret. These matters of secure transmission would surely come into play in the development of our new configuration.
Fortunately, our content partner in TC Generation pulled together a solution to adapt the javascript to PHP essentially to remove the API activation from the client side of the web page and conceal the process within our CMS architecture. This solution was applied to both the “Occuspace” and “Rooms” slides, and fortunately was not needed for either of the event-type slides.
News Problem
As we were approaching a new full configuration of four separate slide carousels, it was brought to our attention that there was nothing in place to address the laborious process for mounting newspaper covers on the Everett Cafe eBoard. The previous configuration in the Cafe was devoted solely to showing this content, but the new Cafe configuration up to this point had simply been to mirror content on the individual eBoards within the Library.
We hastily developed a solution to have newspaper content mounted in LibGuides widgets which would allow us to swap out content at a moment’s notice without having to wait for the cumbersome CMS publication cycle. The process, while laborious, attempted to replicate the most salient features of display while also being manageable for an already overworked staff of library associates.
Finishing Touches
By this point, all that remained in the development process was the stylization of our assets to match other web properties. For this, we relied heavily on the expertise of the Library’s design team, as their input dictated the style of the Occuspace Slide as well as the appearance of posters on event-type slides. We went live with the new configuration for all eBoard screens in all locations on May 9th.
The work described in this post was conducted by this author, along with Michael Rodriguez from TCIT, Dasheng (Jonathan) Zhang from TC Generation, and Soeun Bae from the Library’s Design Team. The rest of the eBoards project team consisted of Amber Protzmann and Jennifer Govan from the Library; Raza Ahmed, Jon MacMillan, and Sonya Jones from TCIT.